Investing alerts for stocks and ETFs
Markets overreact.
We tell you when.
MarketRider watches your stocks every day. When a price drifts too far from its trend, you get a clear alert by email or Telegram: accumulation zone, waiting, or sell zone. No charts to decode, no staring at a screen.
Free to start · No credit card · Cancel anytime
How it works
Three steps, then it runs on its own.
You don't need to know technical or fundamental analysis. You pick the assets you care about; MarketRider does the watching.
Follow your assets
Search for a stock or ETF —or pick a suggested one— and follow it in one click. KO, VOO, whatever you hold.
MarketRider checks daily
Every trading day we compare the price against its trend using the strategy you chose. You don't lift a finger.
You get the alert
When something changes —an asset enters a zone— you get a plain-language email or Telegram message. Otherwise, silence.
Product
A look inside: this is what you use every day.
Real screenshots of the app — no mockups, no promises: what you see here is exactly what you get when you sign up.
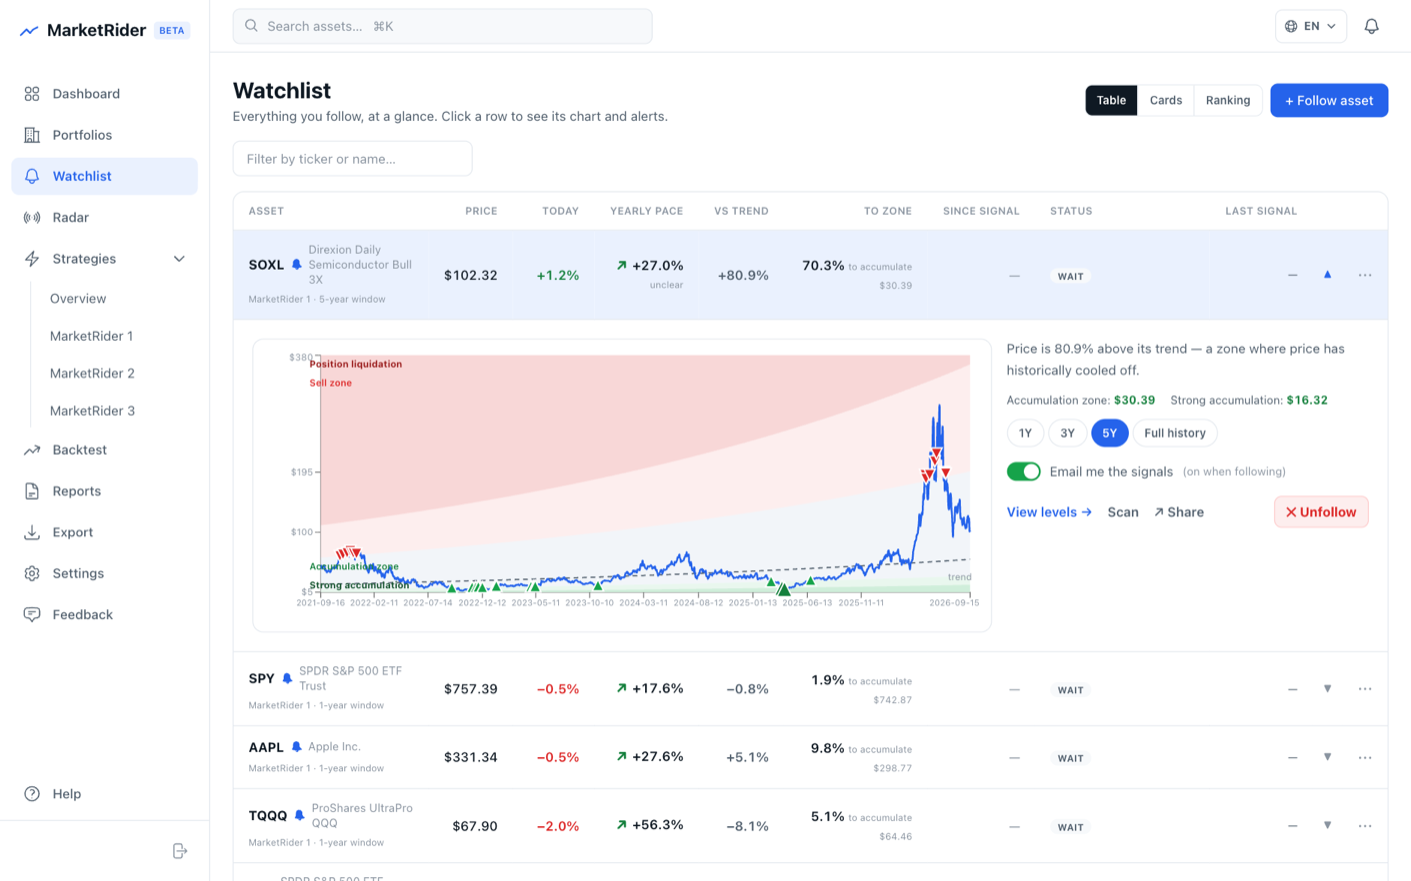
Your watchlist, with a verdict
Every asset you follow tells you at a glance where it stands: its price, how far it has drifted from its trend, how close it is to the accumulation zone and what the strategy sees now.
- A clear status per asset: accumulation, waiting or sell zone
- “To zone”: how far it is from the accumulation zone
- Email alerts switched on just by following an asset
- Zone chart with historical signals marked
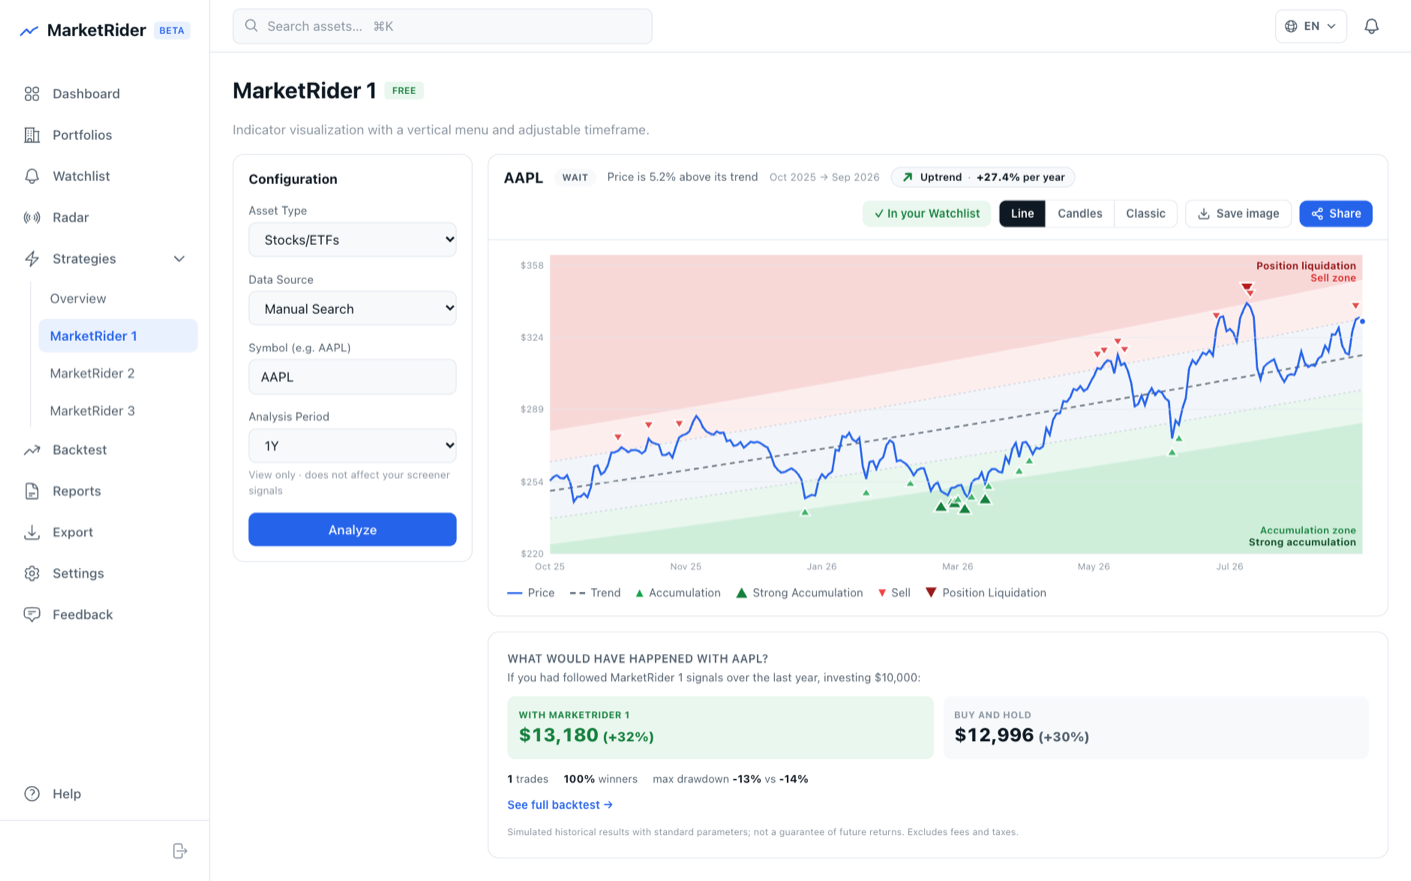
See what the strategy sees
Analyze any asset and see its trend, its zones and every signal the strategy would have produced. And the question that matters, answered with numbers: what would have happened if you had followed it?
- Accumulation and sell zones over the real price
- Line, candlestick or classic view
- Head-to-head comparison against buy and hold
- Full backtest with every trade in detail
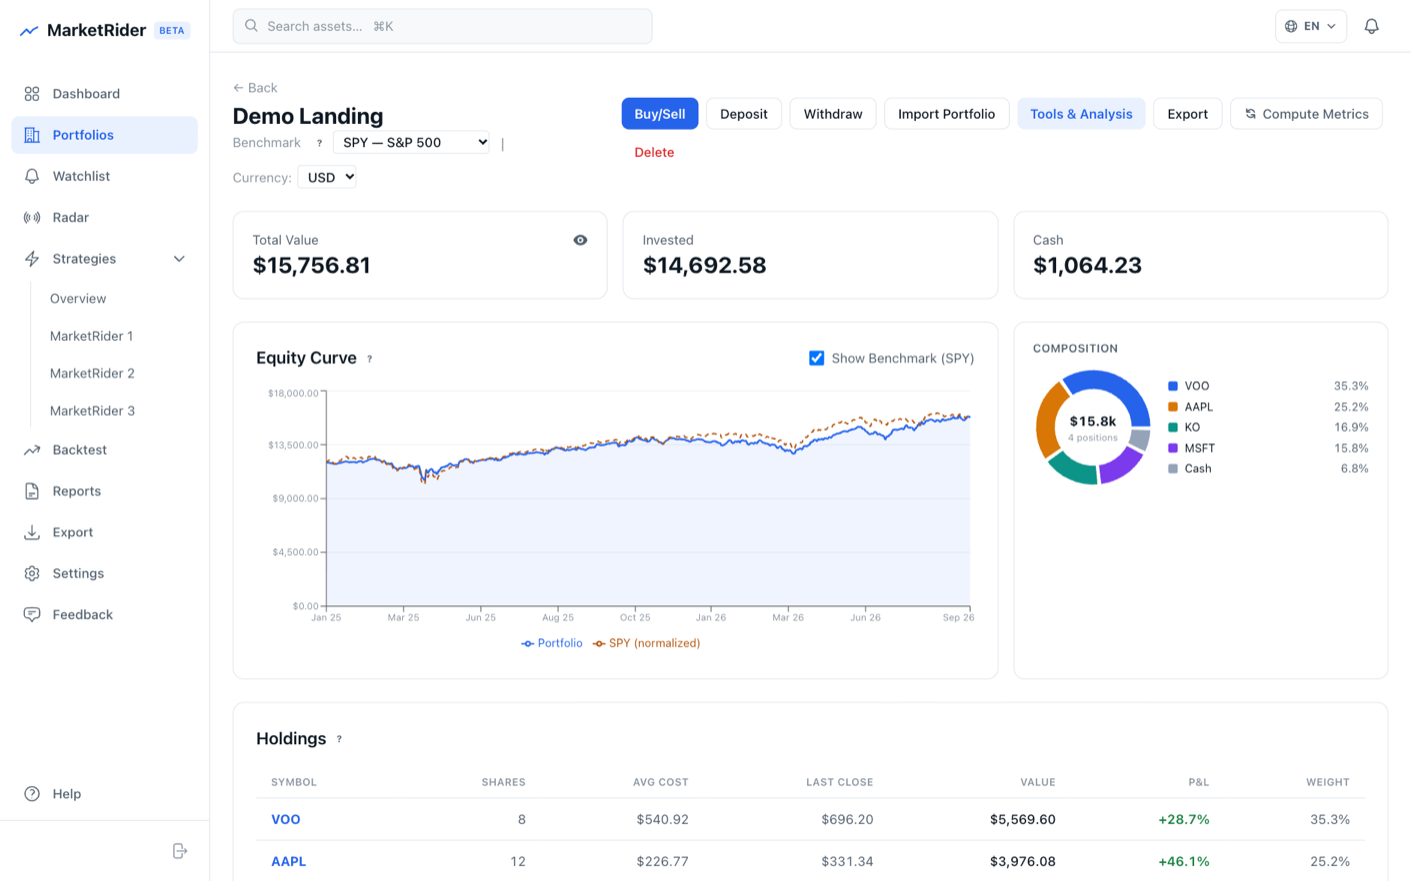
Your money, measured properly
Log your purchases and deposits and MarketRider calculates your real return — separating what you put in from what your investments earned, against the index you choose.
- Equity curve against your benchmark (SPY, QQQ…)
- Composition and weight of every position
- Professional metrics without needless jargon
- In your currency: USD, MXN, COP or EUR
Monthly reports PREMIUM
A plain-language statement: how much you put in, how much it earned and where.
Export everything PREMIUM
Your transactions, positions and metrics as CSV. Your data is yours.
Price alerts PREMIUM
“Tell me if AAPL drops below $200.” Simple, yours, by email or Telegram.
Weekly digest
Your week in 30 seconds: statuses, distance to each zone and your portfolios.
Strategies
Three speeds. The difference is how often they speak up.
All three look for the same thing —prices that are cheap relative to their trend— at different rhythms. Start with the first one for free.
The patient one. Watches the trend over the window you choose —weeks, months or years— and only speaks up on clear deviations. Works for the short term and for long-term accumulation.
The rhythmic one. Follows the most recent trend and trades medium-term deviations. Several signals a year.
The adaptive one. Calibrates itself to each asset's personality: more sensitive where the asset is calm, more demanding where it's volatile.
Results
Don't take our word for it. Check it.
We publish every buy signal our strategies generate — the good ones and the bad ones, uncurated. Each one shows its price, its result and whether it's still open or already closed. No account needed.
See the full track record →Live figures from the public track record. Before fees and slippage; past performance does not guarantee future results.
Pricing
Start free. Upgrade when you need to.
Get started without paying a thing. Premium unlocks all three strategies and unlimited tracking.
Free*
$0
To try it with your first assets
- Full MarketRider 1 (analysis and zones)
- 1 portfolio with metrics
- Follow up to 5 assets
- MarketRider 2 and 3
- Email and Telegram alerts
- Automatic reports and export
* Subject to change
Premium Monthly
$14.99* USD/mo
Cancel anytime · launch price: yours for as long as you stay subscribed
- All 3 strategies with unlimited alerts
- Unlimited portfolios and tracking
- Monthly reports and price alerts
- CSV export of all your data
- Portfolio rebalancing and optimization
* Subject to change
Premium Annual
$152.99* USD/yr
Works out to $12.75 USD/mo — pay for 10 months, get 12 · launch price
- Everything in the monthly plan
- 2 months free every year
- One payment, nothing to remember
* Subject to change
FAQ
What everyone asks first.
How does MarketRider work?
Do I need to know about the stock market?
Does MarketRider buy or sell for me?
How often do alerts arrive?
How do I know the signals work?
Can I cancel anytime?
Is the app available in English?
Let the market overreact.
Create your free account and follow your first assets today. The next alert could be the one.
Create free account